Implementing visualizations
Update 2026-01-20: Improved readability with section headings and added visual examples.
The Challenge of Code-Based Visualization
Creating visualizations with code is difficult. Examples are:
- Processing
- D3
- …
The difficulty of the coding task relies on the abstract nature of code. You have only 2 states: the code and the end result.
Approaches to Bridge the Gap
Some ideas have appeared that seem to solve this:
Real-Time Evaluation
Reducing the gap of evaluation: this is done by executing the code after any change on it and let you see your changes (Any playground: CodeSandbox, Codepen, …)
Modular Execution Graphs
Modularizing and creating the graph of execution (Observable HQ)
Video source: Observable HQ Documentation
Visual Programming: Nodes and Graphs
However the best idea seems to use visualization techniques to visualize the code itself. The most notable examples of this are tools like:
- Noodle
- Node-based shader editors
- Visual graph systems
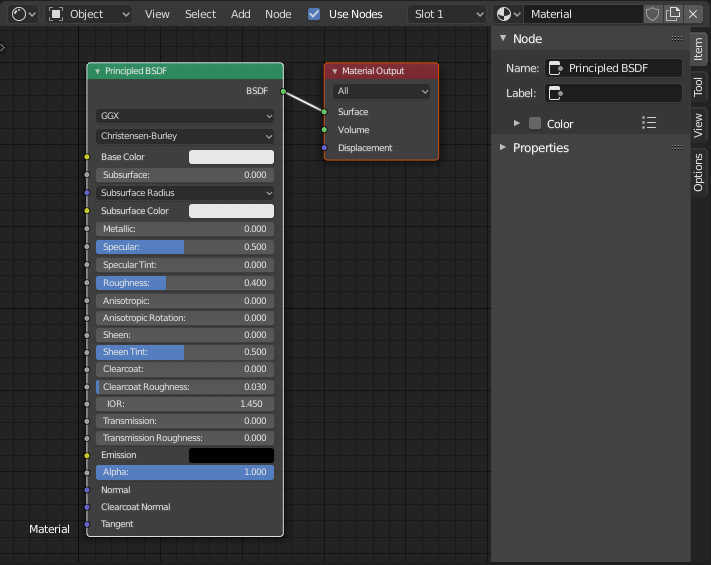 Image source: Blender Shader Editor Documentation
WYSIWYG Approaches
WYSIWYG tools like Webflow tend to show the final result and let you tweak the elements by selecting and then changing parameters.
Excel provides a different paradigm: a graph represented in a table format.
Limitations of Current Visual Tools
Those tools let you see code represented as a graph, but they have shortcomings:
- Verbosity: Simple tasks are reduced to many nodes, creating visual complexity
- Limited Batch Operations: You can only change single elements or a selection of elements with limited operations
- Version Control: Not compliant with versioning tools like git
- Forced Paradigm: Information becomes structured in a certain way and forces a unique kind of thinking - it’s all nodes
- Manual Only: No API to programmatically change elements, everything must be done manually