The Local Maximum; Why Developer Tools Are Stuck in the Past
Introduction
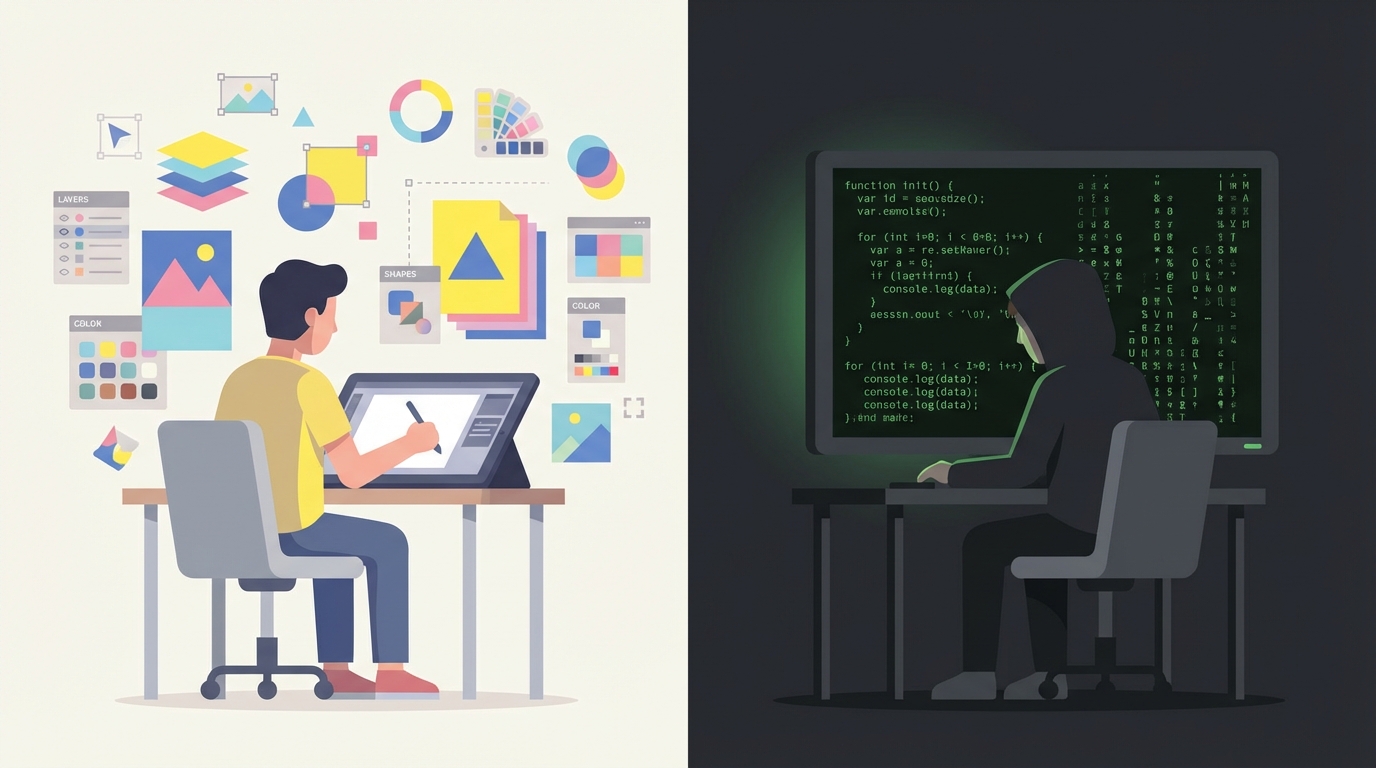
There is a fundamental disconnect in how we build software. While design tools have evolved into spatial, collaborative, and visual canvases (Figma, Miro, Unreal Engine), programming remains stubbornly stuck in a paradigm from the 1970s.
Despite the explosion of complexity in modern software, the interface remains the same: a human typing abstract symbols into a text buffer. This stagnation isn’t due to a lack of effort. The graveyard of alternative approaches is vast. Yet, we always drift back to text.
The problem isn’t that we don’t want better tools. The problem is that we are trapped in a “text-first” reality that rejects any alternative that cannot speak its language perfectly, compounded by an industry culture that actively resists change.
The Paradigm Trap: Text is the Universal Bottleneck
In almost every other creative field, the tool matches the medium:
- Musicians manipulate waveforms and virtual instruments.
- Designers manipulate pixels and vectors on an infinite canvas.
- 3D Artists sculpt geometry in spatial environments.
- Shader artists in Blender connect visual nodes to create materials.
- Game designers in Unreal use Blueprints to script behavior visually.

Programmers, however, do not manipulate the thing they are building. We manipulate a description of the thing. We are like painters forced to write essay descriptions of a sunset rather than painting the sunset itself.
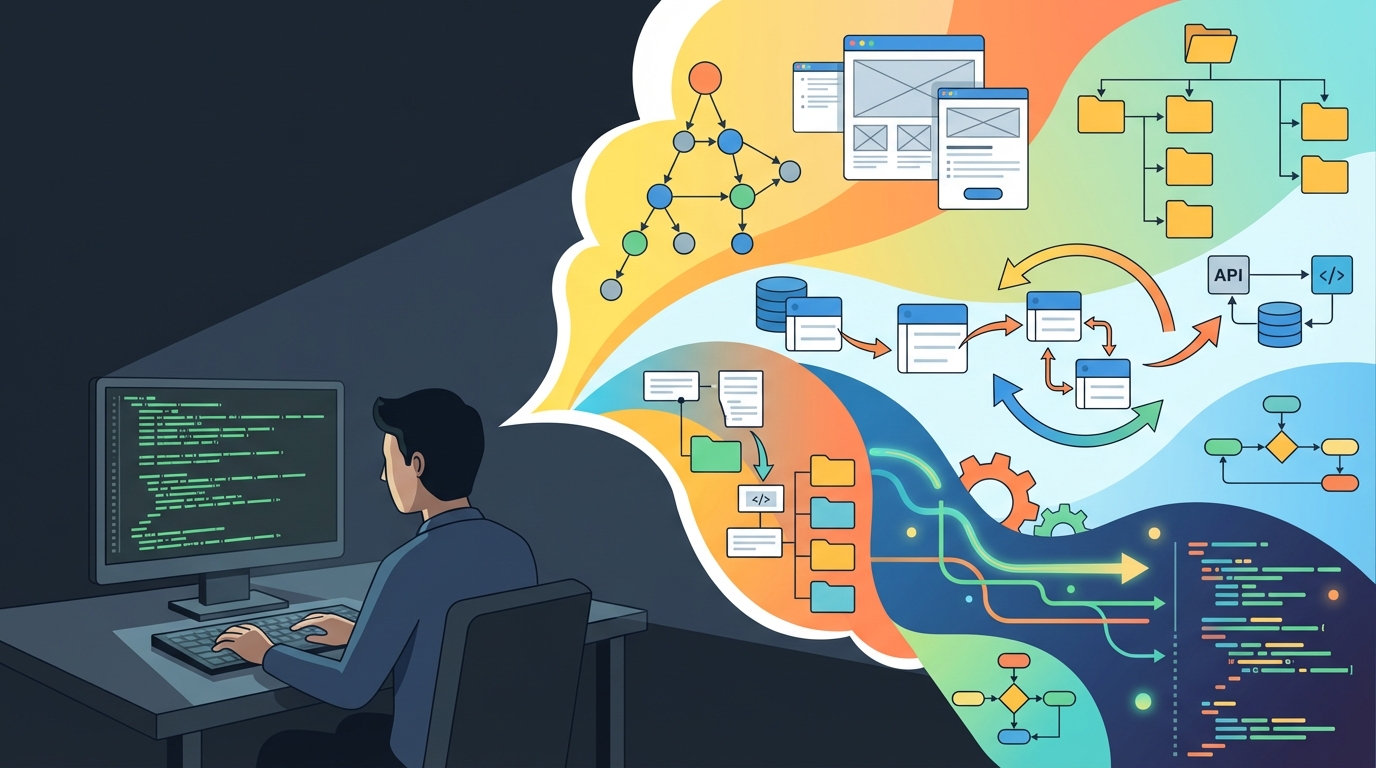
This creates an unnecessarily high cognitive load. To build a system, a developer must simulate the computer’s state in their head, translating abstract text into mental models of data flow. We lack the spatial collaboration, tactile feedback, and direct manipulation that every other digital creator takes for granted.
A Taxonomy of Alternative Approaches
The attempts to escape text can be grouped into distinct paradigms, each with different levels of success and failure.
Tier 1: Mainstream Success (But Limited)
The Flow Paradigm
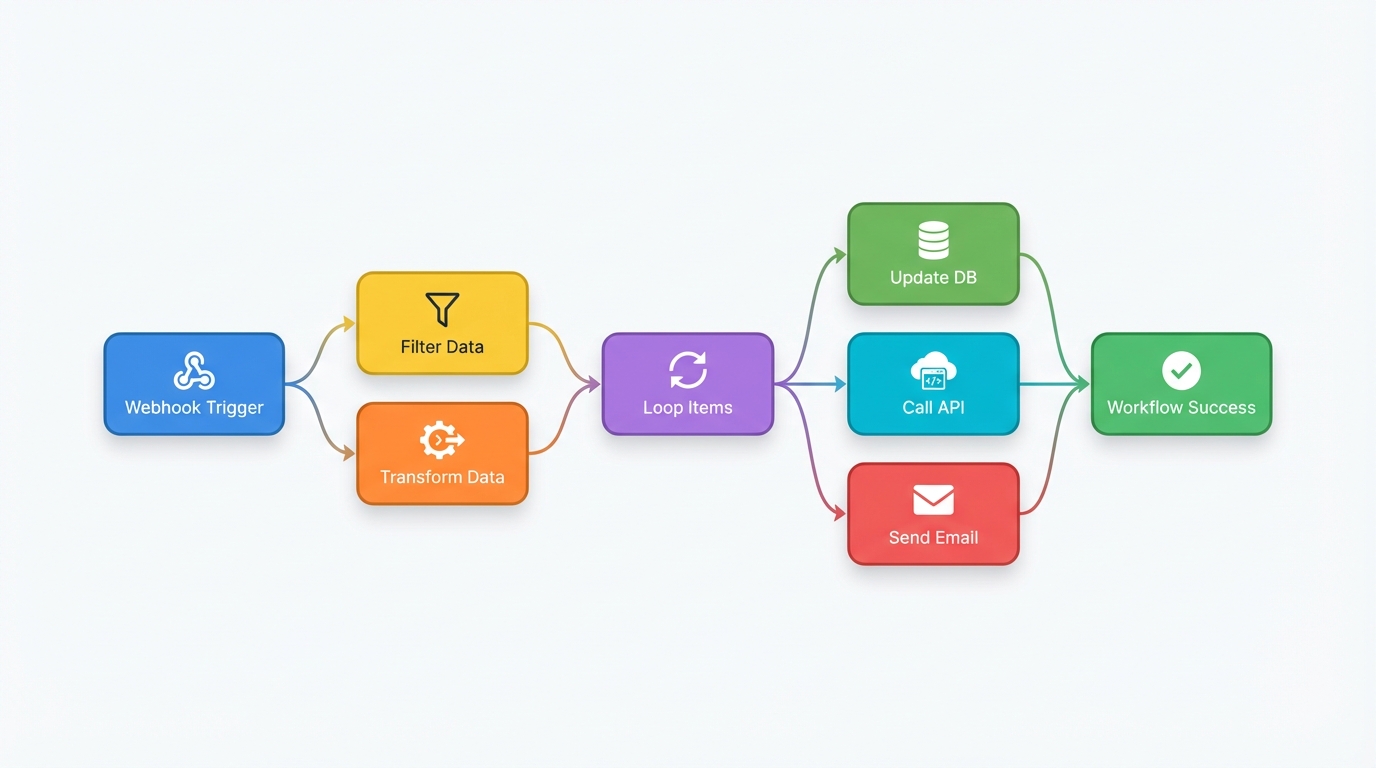
Examples: Zapier, Make, n8n, Node-RED, Unreal Blueprints, Blender Shader Nodes
The flow paradigm is the closest thing we have to a successful visual alternative. It represents logic as nodes connected by wires, with data flowing through the graph. This approach has genuinely caught on: it powers the entire no-code movement and is standard practice in game development and 3D graphics.
Why it partially succeeded:
- Intuitive mental model (data flows like water through pipes)
- Works exceptionally well for linear transformations
- Non-programmers can grasp it quickly
- Domain-specific (shaders, automation) rather than general-purpose
Why it hits a ceiling: As I’ve written elsewhere [1], the flow paradigm forces all logic into a single representation. This works for simple sequences but breaks down catastrophically for:
- Complex data transformations requiring statistical functions
- Library dependencies unavailable in sandboxed environments
- Iteration at scale with error handling across hundreds of items
- Nested business logic that becomes unreadable “spaghetti diagrams”
The representation should adapt to the task, not the other way around. Yet flows demand everything conform to their linear model.
Interactive Notebooks
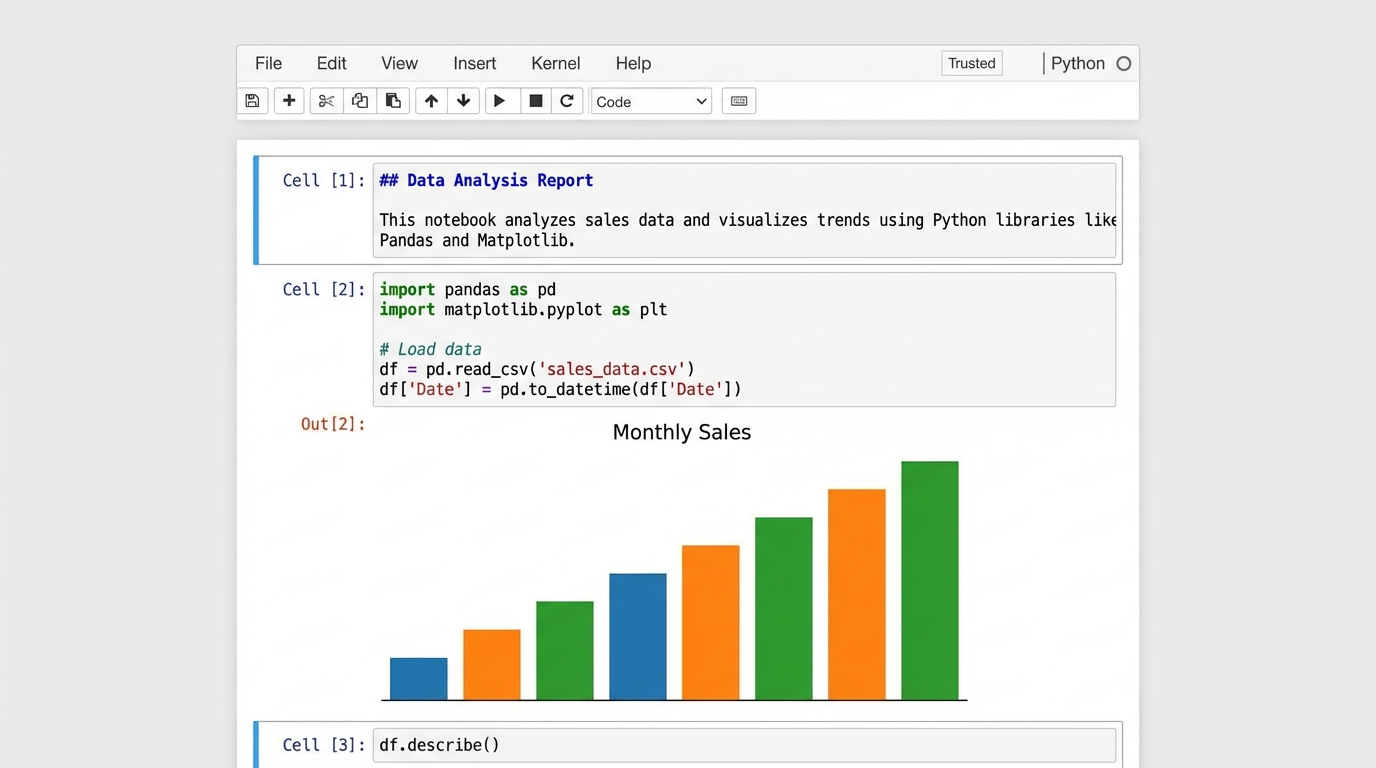
Examples: Jupyter, Observable, R Markdown
Notebooks succeeded in data science by mixing code, prose, and live output. They’re genuinely mainstream in their domain.
Why they partially succeeded:
- Perfect fit for exploratory analysis
- Immediate visual feedback
- Great for communication and documentation
Why they hit a ceiling: Notebooks discourage modularity and promote linear thinking. They’re poor tools for building complex, interconnected applications. Observable tried to visualize the dependency graph between cells but eventually pivoted to markdown files and static dashboard generation: a tacit admission that the reactive graph wasn’t compelling enough for general use.
Tier 2: Niche Success (Domain-Specific)
Geometry-Based Visual Programming
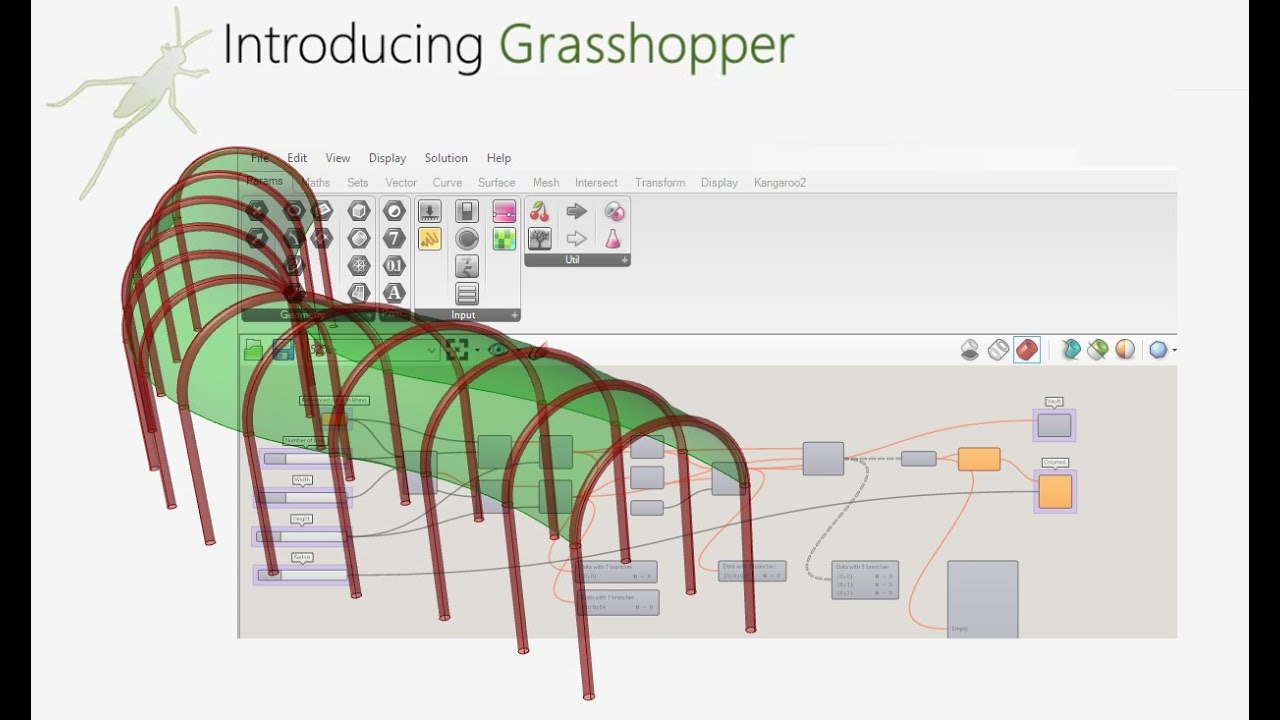
Examples: Grasshopper (Rhino 3D), Dynamo (Revit), TouchDesigner
In architecture and parametric design, visual programming is standard practice. Grasshopper lets architects create complex geometric relationships that would be nearly impossible to express in text.
Why it works in its niche:
- The output is visual (geometry), so visual programming matches the domain
- Parameters map directly to spatial properties
- Iteration and variation are core to the workflow
Why it doesn’t generalize: Most programming isn’t geometric. The success of Grasshopper doesn’t translate to building web APIs or processing business logic.
Audio/Visual Synthesis
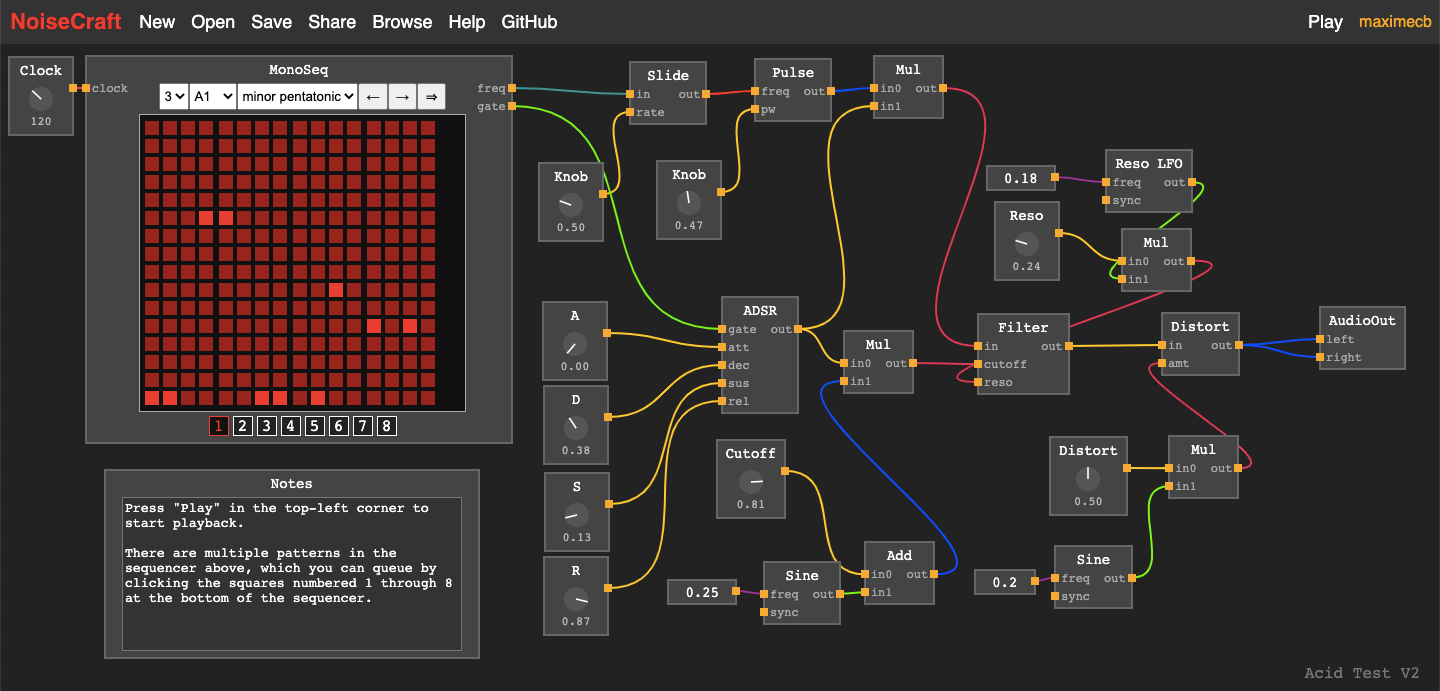
Examples: NoiseCraft, Max/MSP, Pure Data, VVVV
Sound and visual artists have embraced node-based programming for decades. The paradigm fits because audio processing is signal flow.
Why it works in its niche: The metaphor matches reality. Audio literally flows through processing chains.
Why it doesn’t generalize: Same as geometry. The domain happens to match the representation.
Tier 3: Failed Attempts (General-Purpose)
Traditional Visual Programming Languages
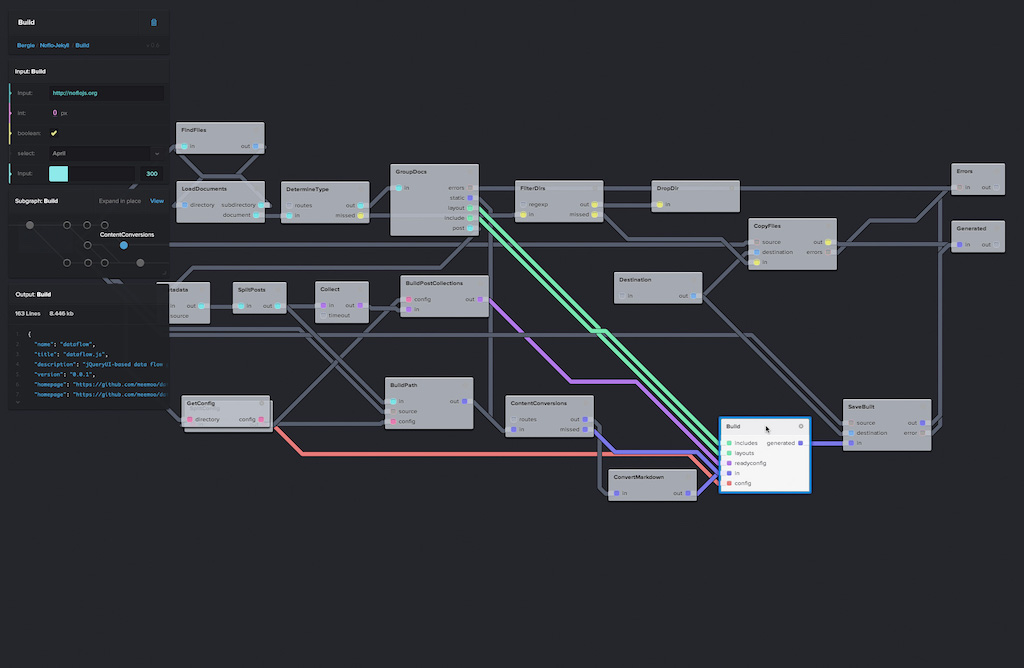
Examples: LabVIEW, Scratch, NoFlo, Flyde, BitSpace, Google Visual Blocks
These tools tried to replace text-based coding with general-purpose visual graphs.
Why they failed: Sebastian Bensu’s analysis [2] reveals the core problem: they solve the wrong problem. Nobody ever made a flowchart to read for (i in 0..10) if even?(i) print(i). Experienced developers already prefer textual representations for business logic. These systems attempt syntax replacement when developers never asked for that.
The problems where visual programming helps (understanding data flow, seeing connections) are different from the problems programmers have (writing logic quickly, refactoring, debugging).
Data-Driven Code Analysis
Examples: GitHub CodeQL, Visual Studio Code Maps, Sourcetrail
These tools treat code as queryable data, letting you visualize dependencies and find patterns.
Why they failed to go mainstream: The visualization is always read-only. You can see your code as a graph, but you can’t edit the graph. It’s a map you can look at but not draw on. Sourcetrail was beloved by its users but couldn’t sustain a business and shut down: a perfect example of a good tool that couldn’t survive the economics of developer tooling.
Live Collaboration
Examples: VS Code Live Share, CodeTogether
Real-time collaboration revolutionized design (Figma) and documents (Google Docs), but has barely touched programming.
Why it failed: Code isn’t like prose. You can’t have two people editing the same function simultaneously without merge conflicts. Programming requires deep focus, and the “Google Docs model” of seeing everyone’s cursors creates more distraction than value.
Tier 4: Reinforcing the Status Quo
AI Assistants
Examples: GitHub Copilot, Cursor, Claude
The current wave of AI tools is impressive but fundamentally conservative. They make writing text faster.
Why they entrench text rather than escape it: AI generates code, but humans must still read and maintain that code as text. The AI is trained on text, produces text, and reinforces text as the medium. If anything, AI has strengthened the text paradigm by making it more productive. We’re just shovel-feeding the text buffer faster.
Case Study: The D3.js Paradox
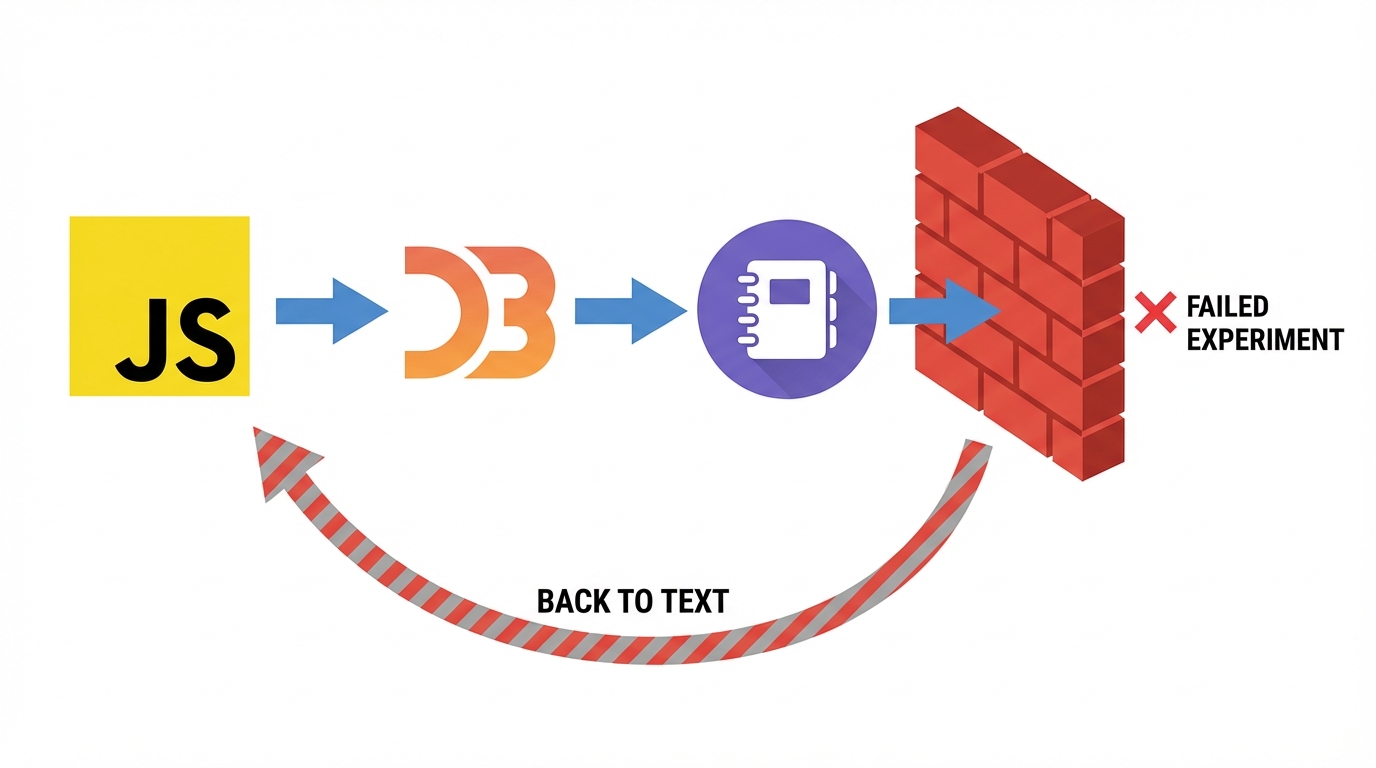
Perhaps no example illustrates the depth of our text addiction better than D3.js, the dominant library for creating web-based data visualizations.
Consider the absurdity: D3 is a tool specifically designed to create visual outputs (charts, graphs, interactive diagrams), yet the entire workflow is purely textual. Developers write JavaScript to manipulate SVG elements they cannot see until runtime. They debug visual layouts by reading coordinate numbers in a console. They iterate on designs by changing numeric values, refreshing, and hoping the result looks right.
This is like sculpting blindfolded, feeling the clay only after each modification.
The creator of D3, Mike Bostock, clearly recognized this problem. He founded Observable [3], a notebook platform that provides immediate visual feedback as you write D3 code. Cells execute reactively, outputs render inline, and you can see your visualization evolve as you type. It was the obvious solution.
And yet Observable pivoted. The company shifted focus from reactive notebooks to Observable Framework [4], a static site generator for dashboards. The reactive, visual-first notebook paradigm wasn’t enough. Even with immediate feedback, even in a domain that is inherently visual, developers preferred tools that output to traditional deployment pipelines and version control systems.
Meanwhile, the other path exists. Tableau, Power BI, and similar business intelligence tools have orders of magnitude more users creating data visualizations than D3.js. Non-programmers drag and drop their way to dashboards that would take a D3 developer hours to code.
But these tools have their own prison:
- Vendor lock-in: Your visualizations exist only within their ecosystem
- Performance ceilings: Complex datasets choke on client-side rendering
- Flexibility constraints: You can only build what the tool anticipated
- Extension difficulty: Custom visualizations require escaping to code anyway
- Stagnant vocabulary: The same bar charts and line graphs, decade after decade
So we have two populations: programmers stuck in text, building anything but slowly, and business users stuck in drag-and-drop, building quickly but only what’s permitted.
The middle ground, where you could visually construct a D3 visualization while retaining the full power of code, remains unpopulated. Observable tried and retreated. The market has spoken, and it said “no” to both visual programming and to notebooks as a bridge.
This isn’t a failure of imagination. It’s a failure of ecosystem compatibility. Observable notebooks couldn’t be easily version-controlled, couldn’t be deployed like regular web apps, couldn’t integrate cleanly with existing codebases. The visual feedback was valuable, but not valuable enough to justify the friction.
What Developers Actually Want to Visualize
Bensu’s key insight [2] deserves emphasis: developers don’t want to write code visually; they want to understand code visually. The things worth visualizing are:
- Codebase structure: dependencies, class hierarchies, module relationships
- Network topologies: service connections and data flow between systems
- Memory layouts: how data is physically arranged
- State transitions: state machines and their valid paths
- Request/response flows: what happens during an HTTP request
These are things that are important, implicit, and hard to understand from reading code alone. Successful visualizations (flamegraphs, AWS architecture diagrams, database schema tools) address these genuine pain points rather than attempting syntax replacement.
The Real Barriers: Why We Can’t Escape
The Bi-Directional Gap
Software engineering rests on a massive text-based ecosystem: Git, diffs, linters, compilers, package managers.
- If you build a Visual Tool, you break compatibility with Git.
- If you build a Visual Tool, you can’t easily “grep” your logic.
- If you build a Visual Tool, you can’t copy/paste from StackOverflow.
Visual and text representations are not bijectively equivalent. You can turn a visual graph into code, but you cannot easily turn arbitrary code back into a clean graph. The conversion is one-way, forcing developers to abandon the ecosystem or stick with text.
They rightfully choose text.
The “Not Invented Here” Syndrome
Developers are uniquely positioned to build their own tools, and uniquely inclined to dismiss tools built by others. “I could build that” transforms into “therefore it has no value.”
When a developer sees a visual tool, the reaction is often “I would have done it differently” rather than evaluating it on its merits. This kills adoption before tools can prove themselves.
The Open Source Expectation
Developer tools face an impossible economic equation. Developers expect tools to be free and open source. They’ll pay $200 for a chair but resist paying $20 for an IDE plugin.
Compare this to other creative fields: musicians pay for DAWs, designers pay for Adobe, 3D artists pay for Cinema 4D. In programming, the expectation of free tooling means innovation happens as side projects that get abandoned or as corporate loss-leaders.
The Performance Obsession
The current darling of the developer world is Zed, an editor whose primary selling point is speed. Developers switch editors not for better visualization or understanding, but for faster text manipulation.
We don’t want fundamentally different tools; we want the same tools, but faster. Optimization of the existing paradigm is more appealing than paradigm shift.
The Education Problem
Programming education is entirely text-based. From “Hello World” to university curricula, we teach people to think in text from day one. By the time developers encounter visual alternatives, their mental models are already calcified around textual representation.
Musicians learn to read notation and manipulate instruments. Architects learn to draw and use CAD. But programmers learn only text, and then we’re surprised when they reject visual alternatives as “not real programming.”
This isn’t inevitable. MIT’s Scratch proved that visual programming can be an effective teaching tool. But we treat it as training wheels to be discarded rather than a legitimate paradigm to be developed alongside text.
The Budget Problem
In companies, developer tools receive almost no investment:
Salesperson needs to spend $1000? No big deal. Finance needs to spend $100,000? No big deal. Engineer wants to buy a $50 book? They need forms signed from their VP in triplicate.
Developer productivity is notoriously hard to measure, so tools that improve it can’t demonstrate ROI. The total addressable market looks large (millions of developers) but willingness to pay is near zero. VCs have learned this, and funding for non-AI developer tools has dried up [5].
The Cultural Identity
Perhaps the deepest barrier is cultural. Programming has a mythology built around text: the hacker in a terminal, the elegance of code, the craft of clean syntax. Visual tools feel like “cheating.”
We’ve turned a historical accident (that early computers could only handle text) into a professional identity. Suggesting visual tools might be better implies “real” programmers need training wheels.
The Path Forward: What Might Actually Work
We keep trying to replace text rather than augment it. The text editor is a local maximum. To escape, we need different approaches:
1. Context-Adaptive Representations
Instead of forcing everything into one paradigm (flows, text, or otherwise), tools should offer multiple representations that adapt to the task:
- Spreadsheet-style reactive cells for calculations
- State machine diagrams for entity transitions
- Flow graphs for data pipelines
- Text for algorithmic logic
A unified canvas where different components use whichever visual language best expresses their function.
2. Visualization as a Lens, Not a Replacement
Instead of replacing the text editor, augment it with views:
- Inline visualizations of data flow
- Spatial views of module dependencies
- Visual debugging that shows state changes over time
- Automatic diagrams generated from code structure
The text remains the source of truth; visualization becomes a lens for understanding.
3. Focus on Understanding, Not Writing
Most visual tools focus on making code easier to write. The bigger opportunity is making code easier to understand. Developers spend far more time reading and comprehending code than writing it.
Tools that help you see the shape of a system, trace data flow, or understand the impact of a change (without requiring you to abandon text for editing) have a better chance of adoption.
4. Bi-Directional Fidelity
The next generation of tools must be truly bi-directional:
- Changes in the visual representation instantly update the text
- Changes in the text instantly update the visual representation
- Both are first-class citizens
This is technically hard but not impossible. CSS visual editors that update code in real-time are an early example.
5. Fix the Economics
Until developers are willing to pay for tools, or companies budget for developer productivity, innovation will remain underfunded. The open source ethos is admirable, but it has starved the ecosystem of resources needed for ambitious tooling projects.
6. Reform Education
Teach visual programming alongside text from the beginning. Don’t treat Scratch as training wheels; develop it as a parallel paradigm. Show students that different representations suit different problems.
Conclusion
We are writing 21st-century software with 20th-century interfaces. The innovation isn’t lacking. The graveyard of alternative approaches proves that people have tried. The flow paradigm partially succeeded. Domain-specific visual tools thrive. But general-purpose programming remains imprisoned by text.
The barriers are technical (bi-directional conversion), economic (no one pays), cultural (text as identity), educational (text-only training), and psychological (not invented here). Good ideas fail not because they’re bad, but because they can’t overcome these compounding obstacles.
The D3.js paradox captures it perfectly: even when building visualizations, even when the creator builds a visual-first notebook platform, even when immediate feedback is obviously valuable, the ecosystem pulls us back to text files and traditional deployments.
The path forward isn’t revolution; it’s evolution. Tools that augment text rather than replace it. Visualizations that address what developers actually struggle with (implicit complexity) rather than what we assume they want (syntax replacement). Multiple representations for multiple problems.
Until then, we remain stuck, describing our paintings in elaborate prose, one character at a time, while insisting this is the only legitimate way to create.
References
[1] S. Perez Vasseur, “Beyond Flows: Why Visual Automation Needs a New Paradigm,” 2026. https://sebaspv.com/2026/01/18/beyond-flows-why-visual-automation-needs-a-new-paradigm.html
[2] S. Bensu, “Demand for Visual Programming,” 2024. https://blog.sbensu.com/posts/demand-for-visual-programming/
[3] Observable, Inc., “Observable: The JavaScript notebook.” https://observablehq.com/
[4] M. Bostock, “Introducing Observable Framework,” Observable Blog, 2024. https://observablehq.com/blog/observable-2-0
[5] D. Feldman, “Developer Tool Economics,” Twitter/X, 2024. https://twitter.com/d_feldman/status/1779203622351339955
[6] Flyde, “Visual Programming for Developers.” https://www.flyde.dev/
[7] E. Widlund, “Introducing BitSpace: A Playground for Your Creative Ideas,” Polar.sh. https://polar.sh/emilwidlund/posts/introducing-bitspace-a-playground-for-your-creative-ideas
[8] NoiseCraft, “Visual Audio Synthesis.” https://noisecraft.app/
[9] Google, “Visual Blocks for ML.” https://visualblocks.withgoogle.com/
[10] Microsoft, “Microsoft Fabric Overview,” YouTube. https://www.youtube.com/watch?v=IuUXCrtejH8